While the official Federal communications commission statistic that 21.3 million people lacked access to broadband service of at least 25 megabits per second down and 3 megabits per second up (25/3 for short) is well-known, less recognized is the fact that of these, 4.8 million people or 2.2 million housing units had access to no providers (gray areas). Almost 70 percent or 1.5 million of these housing units were in rural areas.
These are some key findings of a new report published by the Purdue Center for Regional Development that looked not only at access but also quality of service (measured by the median advertised speeds reported) as well as competition among providers.
A sizeable digital divide persists between urban and rural: consider that the share of rural housing units with no access to 25/3 was 20 times larger than the share of urban housing units (26.9 versus 1.4 percent). When it comes to symmetrical 25/25 speeds, the share of rural housing units with no access more than doubles from 26.9 to 64.7 percent.
Symmetrical speeds, where the connection has the same download and upload speed, are critical nowadays given that more and more businesses and homes not only consume (download) but also produce (upload).
So, quality of service (QoS), measured by median advertised speeds and not only mere access, is important to understand. Median speeds are more accurate than average because this value is in the middle of the range. In other words, half of the speeds are above this value and half or lower. Averages can be skewed by very few very high or very low records.
(FCC Form 477 has serious limitations but can still provide valuable information for local planners and policymakers.)
The most-offered technology when it comes to broadband was DSL, which was advertised to 121 million housing units or 88.7 percent of all housing units in the country (75.7 percent in rural). However, its median download/upload speed across more than 9 million records was a shocking asymmetrical 15/1 Mbps. These speeds do not meet the FCC’s official definition of broadband in either the upstream or downstream direction. Fiber-optic connections on the other hand had the highest median advertised download/upload speeds and was the closest to offering symmetrical service.
And yes, median advertised speeds were lower in rural compared to urban regardless of broadband technology (except for DSL upload and fiber download). See table below.
When it comes to competition, two types of providers were identified. One, referred to as the Top 6, includes the largest providers (advertised to at least 10 percent of housing units in the country) while the second is all other providers.
The figure below consists of three mutually exclusive layers to showcase where these providers do not overlap:
- Blue shows areas served only by Top 6 providers. Darker blue indicates places served by more than one Top 6 -provider (but no other type of provider is available).
- Green shows areas served only by providers that are not Top 6. This category includes cooperatives. Darker green indicates where service areas of these other providers overlap.
- Gray shows where no provider advertised internet service.
- Orange shows where Top 6 and other providers overlapped.
About 35 percent of housing units in the country had access to Top 6 providers only (blue layer) compared to 7.9 with access to other providers only (green layer). About 55 percent of housing units in the country had access to both types of providers (orange layer). In rural areas, top 6 only providers advertised to 24.6 percent compared to 27.1 percent advertised by other only.
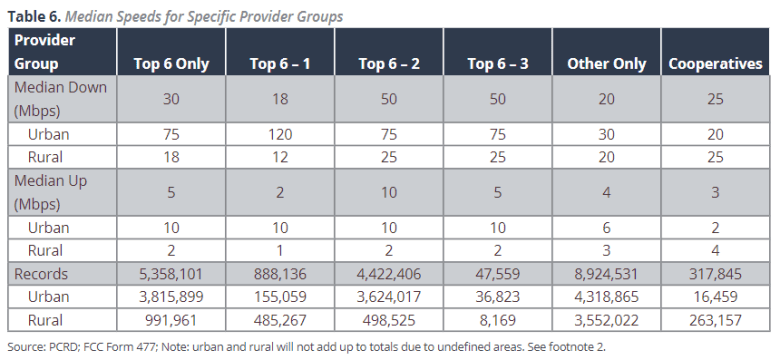
Overall, top 6 only median advertised speeds were higher compared to other only speeds, as shown in the table below, except in rural areas where the other only speeds were higher (20/3 compared to 18/2 Mbps). Note how rural advertised speeds were lower compared to urban (except for cooperatives) regardless of provider type. See table below.
So, what are the key takeaways from this study?
- Digital deserts exist, more so in rural areas.
- The urban-rural access divide is sizeable and still persists.
- A little less than half of housing units in the country are sliced up in between either top 6 only providers or other providers only.
- The technology with the largest footprint in the nation (DSL) also has the lowest median advertised speeds pointing to a potential quality of service issue.
- “Other only” providers advertised to a larger share of rural housing units compared to Top 6. Therefore, federal incentives and state broadband programs need to ensure these providers also receive funds to expand or upgrade infrastructure.
- Lastly, given that median advertised speeds are higher when more providers overlap, overbuilding concerns need to be reconsidered.
Roberto Gallardo, Ph.D., is assistant director of the Purdue Center for Regional Development. Brian Whitacre is a Sarkeys Distinguished Professor at Oklahoma State University.


